|
MPU Debugging with smxAware
by David Moore
January 11, 2022
smxAware was enhanced with new features to help debug issues related to the Memory Protection Unit in SecureSMX systems. These are covered here.
The IAR debugger displays the MPU registers like this:
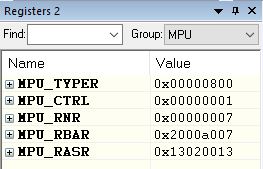
RNR can be manually patched to the slot number to view, which then shows the RBAR and RASR values for that slot. A separate display shows RBAR and RASR for the 4 slots starting at slot RNR.
But what does it mean? To decipher the values, you need to refer to the ARM manual to break out the fields of RBAR and RASR and write them down, and repeat this for all 8 or 16 slots. It would be tedious and very distracting to have to keep doing this. Moreover, there's no indication of what each region is for.
The MPU and MPA displays in smxAware show this very clearly, even indicating the name of each region. This is a huge help in determining the cause of a Memory Manage Fault (MMF). The MPU display shows the regions currently in the MPU. The MPA display shows the MPU images for all tasks in the system. Each shows the regions that will be loaded into the MPU on a switch to that task.
The following shows the MPU when LED_task is running:
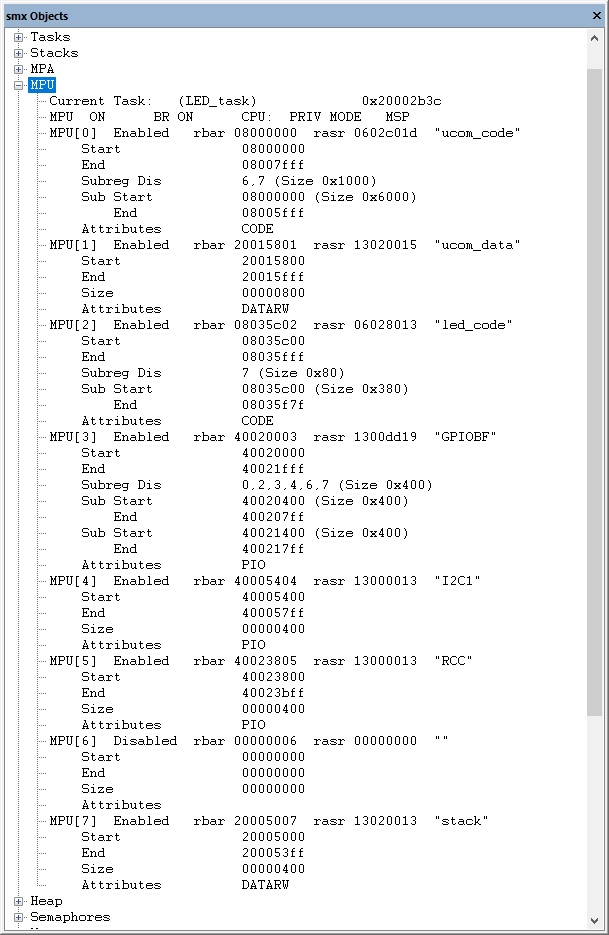
A few things to discuss:
- A simple slot such as MPU[1] shows the Start, End, Size, Attributes, and name, as well as the actual MPU RBAR and RASR register values.
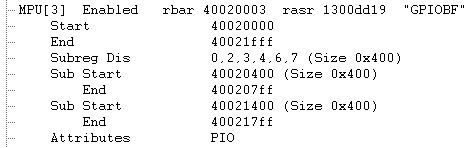
- A more complex slot such as MPU[0] also shows disabled subregions. Usually these are at the end, but as shown for MPU[3] (GPIOBF), they can be any of the 8. Sub Start/End indicate the area mapped by the enabled regions. In this case, 1 and 5 (missing from the disabled list) are enabled, and the Start/End show their extents.
- The name is assigned when built for debug. The MPU itself has no provision to name regions. For release, names can be turned off with a single switch, which makes the code use the fast MPU loading feature of the Cortex-M MPU.
- ucom_code contains common code such as SVC and portal client shell functions. It also contains some common C library functions and some BSP code. The latter should be moved out of it in your system to appropriate regions, but this level of separation wasn't done in our demo. It and ucom_data contain other functions and variables related to debug, etc. that wouldn't be present in a shipped system.
- Slot 6 is unused.
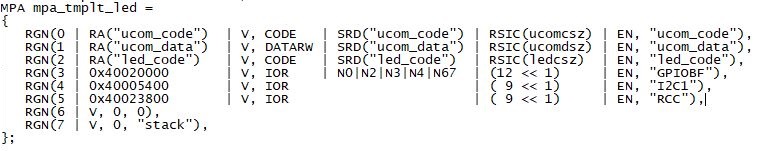
- This task's MPA is defined in the code like this. (This is actually the template that is used to initialize the MPA when the task is created. The MPA can have a subset of its slots, and the MPA can be changed dynamically to swap in/out predefined regions or to add regions created securely for protected blocks and messages that are allocated.)
The MPA display lists all of the tasks:
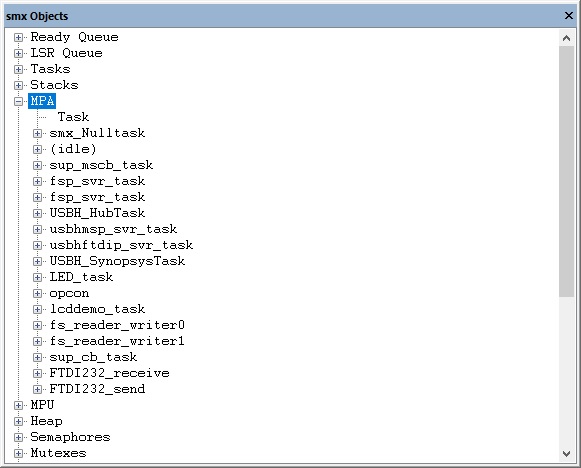
Expanding one is similar to the MPU display.
The MPU/MPA display makes it possible to diagnose Memory Manage Faults because it lets you see all of the regions accessible to the current task and the extent of each region. To demonstrate this, I forced an MMF in our LED task. When it occurs, the debugger stops execution and the call stack looks like this:
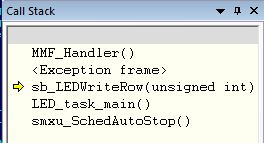
The last call in the call stack before the handler is sb_LEDWriteRow(), and when double-clicked the disassembly shows it was on the first instruction.
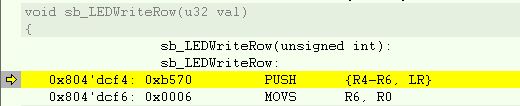
The address of the first instruction (0x0804dcf4) is outside all of the regions in the current MPU (see starts/ends in the MPU shown above), so the fault was when calling this function. It needs to be located in a code section that is in one of the regions shown, e.g. ucom_code or led_code. We normally put it in ucom_code for use by multiple tasks, but it could also be put in led_code if used only by LED_task. It is achieved by this pragma at the top of led.c:
#pragma default_function_attributes = @ ".ucom_text"
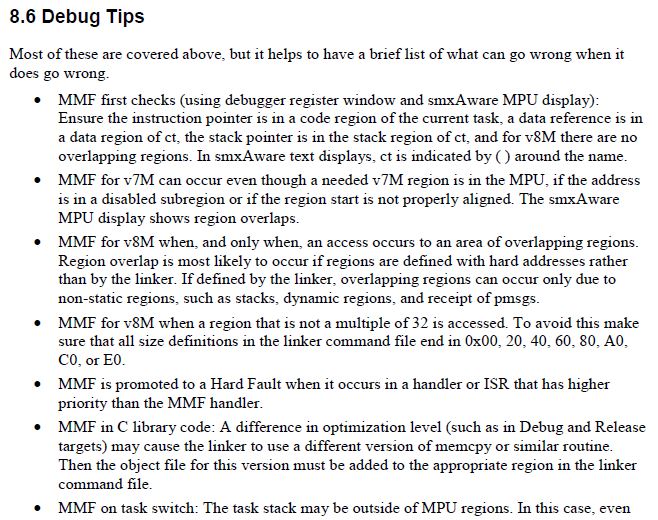
If the call stack and disassembly showed the fault occurred on a move instruction or other data access, then look at the registers to see what the attempted source and destination addresses were and whether either is out of range of all slots. Sometimes MMFs can occur due to unusual situations (such as region overlap on v8), so see the Debug Tips section of the Debug chapter in the SecureSMX manual for suggestions. Here are the first several points to give the idea. The first point covers the two most common cases just mentioned.
smxAware helps with debugging portals. The following are example MPAs for client and server tasks.
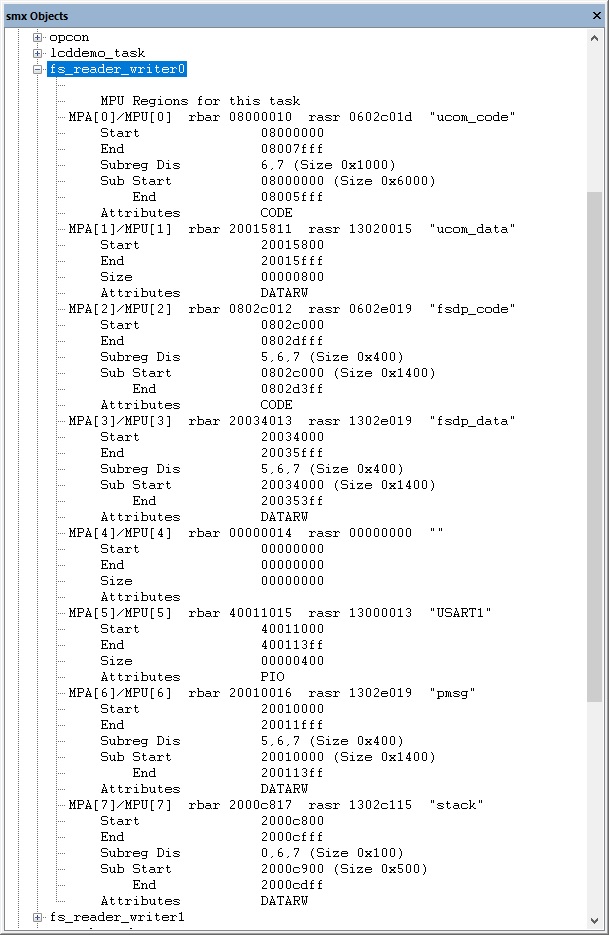
fsdp_code/data contain smxFS demo code that accesses smxFS via a portal. These do not contain smxFS library code and data. pmsg is a region for a tunnel portal message used for the client tasks to make indirect calls to the smxFS API.
By contrast, the smxFS portal server task has the smxFS library code and data regions, plus the IO regions to access SDMMC and DMA registers, as well as its own copy of the pmsg region:
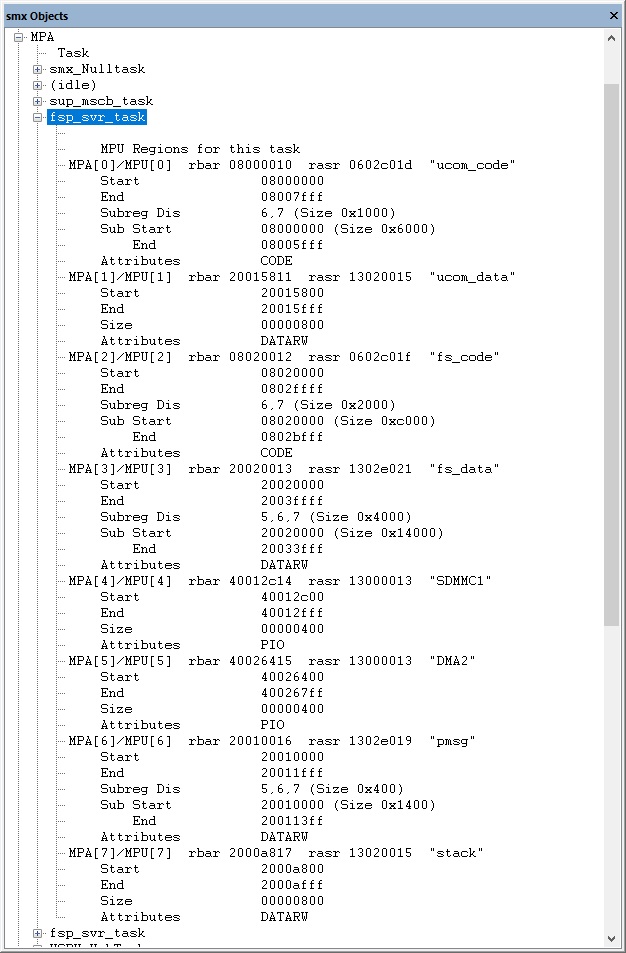
Using the map file produced by the linker, especially the modified version created by our MpuMapper utility, you can see what functions and variables are in each region.
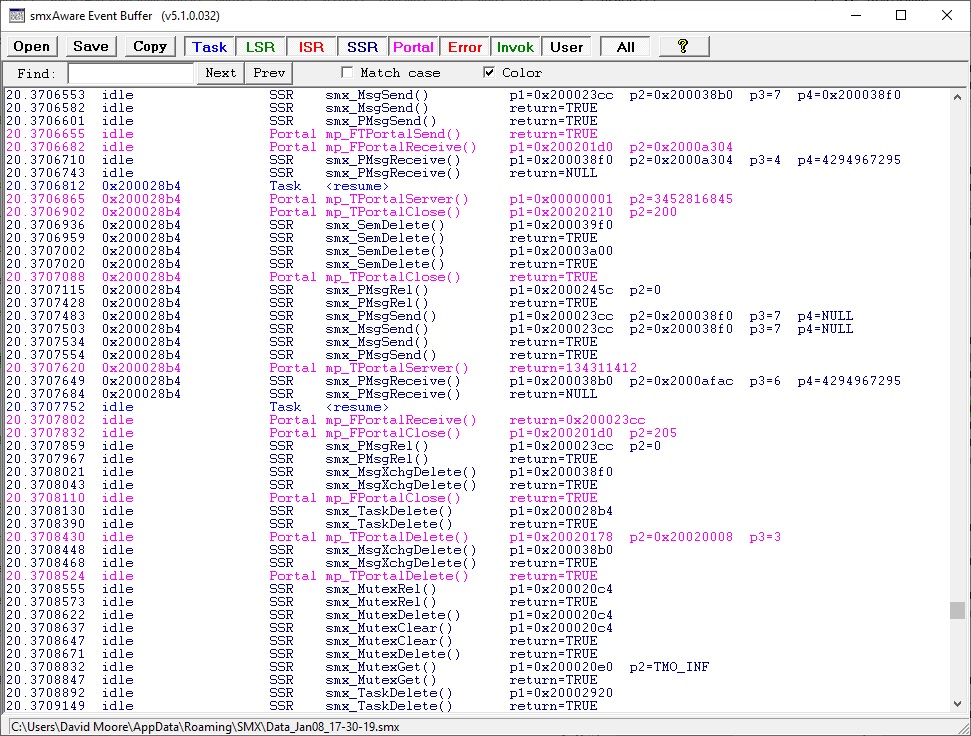
smxAware shows portal operations in the Event Buffer like this:
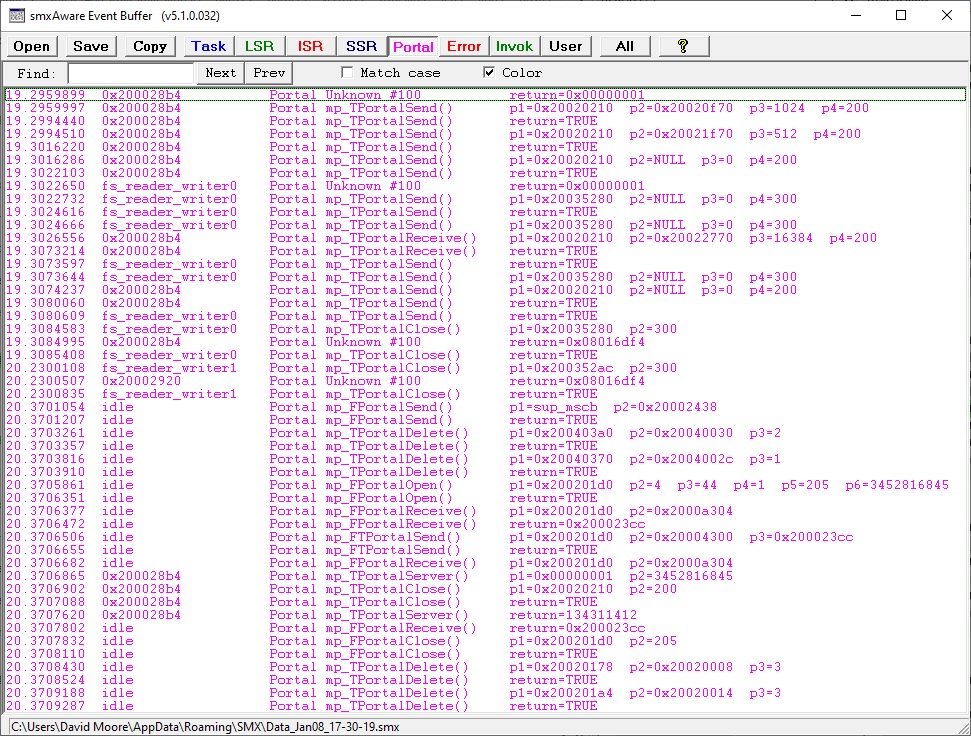
If only the Portal filter button at the top is selected:
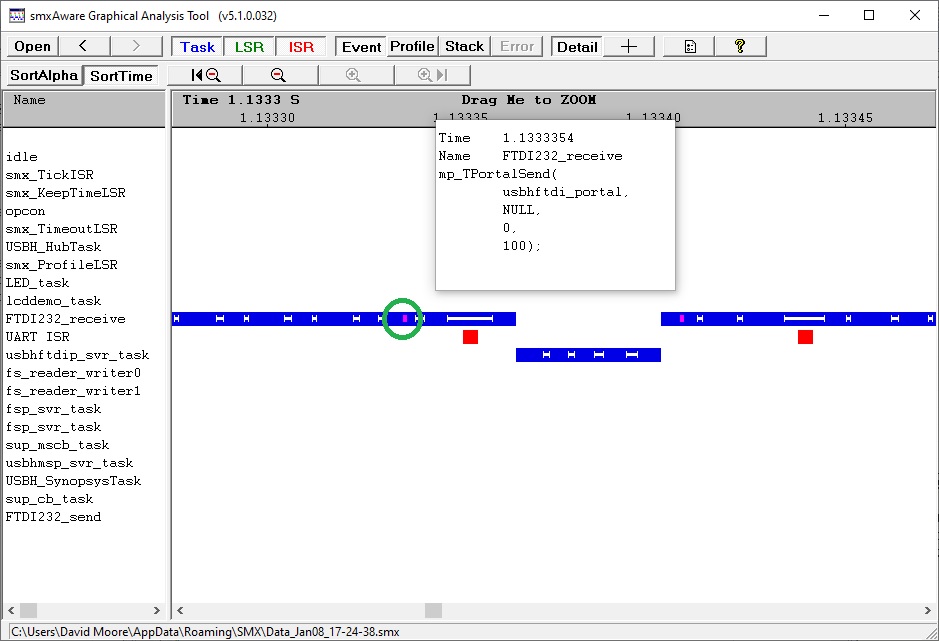
Portal events are also shown on the timelines graph as purple dots. See the circled one below and the details about it that appear when the Details button is clicked.
smxAware is vital to see what the MPU currently looks like as well as the images for each task, in order to diagnose Memory Manage Faults. It is also helpful to debug portal issues by showing the events in the event buffer and the graphical event timelines display. We co-developed these new features right along with SecureSMX because we needed them to do the work. In addition, we have given detailed debugging tips in the manual to help solve problems you may encounter.
David Moore is the Director of Engineering at Micro Digital.
Copyright © 2022 Micro Digital, Inc. All rights reserved.
|